RF circuits acting strangely? Signals weak or noisy? Mismatched impedances might be stealing your power and corrupting your data, a problem I’ve seen derail projects many times.
The primary goal of RF PCB impedance matching is to maximize power transfer between stages and minimize signal reflections. This ensures signal integrity by preserving the information content and energy efficiency of the RF signal.

It sounds straightforward, but as I’ve learned over nearly 20 years in hardware engineering, achieving good impedance matching means deeply understanding what goes wrong when it’s ignored and how every tiny PCB feature can play a big role. Let’s explore this critical aspect of RF design further, because it’s not just about preventing power loss, but also about maintaining the signal-to-noise ratio1 (\(SNR\)) and preventing issues like intersymbol interference (\(ISI\)) that can cripple a system.
What happens in an RF circuit if impedances are mismatched?
Designing an RF circuit but worried about performance? I’ve seen designs falter because mismatched impedances caused serious issues, degrading signal quality.
Mismatched impedances in RF circuits cause signal reflections, leading to power loss, reduced signal-to-noise ratio (\(SNR\)), and potential damage to components. Standing waves can also create damaging voltage peaks.
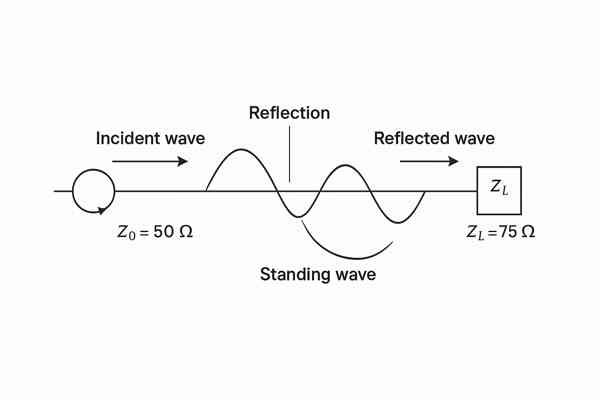
When an RF signal traveling along a transmission line encounters an interface with a different impedance, a portion of the signal’s energy is reflected. This is a fundamental concept, but its implications are far-reaching in high-frequency design. The severity of this reflection is quantified by the reflection coefficient2 (\(\Gamma\)) and the Voltage Standing Wave Ratio3 (\(VSWR\)). In an ideal world, we aim for \(\Gamma = 0\) and a \(VSWR\) of \(1:1\), meaning all power is transmitted. However, achieving perfection is rare. For instance, a \(VSWR\) of \(1.5:1\), which many might consider acceptable in some contexts, already means about 4% of your precious power is reflected. If it climbs to \(2.0:1\), that reflected power jumps to over 11.1%. I always refer to foundational texts like "Microwave Engineering" by David M. Pozar for the underlying equations.
This reflected power isn’t just lost; it can cause several problems:
- Signal Distortion: The reflected waves can combine with the incident waves, creating constructive and destructive interference. This distorts the signal’s amplitude and phase. In digital RF systems, this is a nightmare, leading to intersymbol interference4 (\(ISI\)), where one symbol blurs into the next, corrupting data. In analog systems, it can manifest as non-linearities and a general degradation of signal quality.
- Component Stress: The standing waves resulting from reflections create voltage and current maximums along the transmission line. These peaks can exceed the voltage ratings of sensitive components or cause excessive current leading to overheating, particularly in power amplifiers. I’ve debugged systems where mysterious PA failures were eventually traced back to severe mismatches.
- Frequency Instability: For components like oscillators, reflected power can "pull" the operating frequency, leading to instability and unpredictable behavior.
- Reduced Signal-to-Noise Ratio (\(SNR\)): Less power reaching the intended destination and the potential introduction of noise-like effects from reflections inherently degrade the \(SNR\). This is especially critical in receiver front-ends.
Here’s a table to illustrate how \(VSWR\) impacts power transmission, derived from standard RF formulas you’d find in texts like "RF Circuit Design" by Chris Bowick:
| \(VSWR\) | Reflection Coefficient (\(|\Gamma|\)) | Return Loss (\(\text{dB}\)) | Mismatch Loss (\(\text{dB}\)) | % Reflected Power | % Transmitted Power |
|---|---|---|---|---|---|
| \(1.0:1\) | \(0.00\) | \(\infty\) | \(0.00\) | 0.0 | 100.0 |
| \(1.1:1\) | \(0.048\) | \(26.44\) | \(0.01\) | 0.23 | 99.77 |
| \(1.2:1\) | \(0.091\) | \(20.83\) | \(0.04\) | 0.83 | 99.17 |
| \(1.5:1\) | \(0.20\) | \(13.98\) | \(0.17\) | 4.0 | 96.0 |
| \(2.0:1\) | \(0.333\) | \(9.54\) | \(0.51\) | 11.1 | 88.9 |
| \(3.0:1\) | \(0.50\) | \(6.02\) | \(1.25\) | 25.0 | 75.0 |
Understanding these consequences is the first step to appreciating why meticulous impedance matching is non-negotiable in RF PCB design.
How is microstrip trace width set for a 50-Ohm RF impedance?
Need a specific impedance for your RF traces? I’ve seen enough projects where "eyeballing" the trace width led to poor RF performance. Guessing won’t cut it.
Microstrip trace width for a \(50-\Omega\) RF impedance depends critically on the PCB’s dielectric constant (\(\epsilon_r\)), the height of the dielectric (\(h\)) above the ground plane, and the trace copper thickness (\(t\)). Specialized calculators or validated formulas are essential.
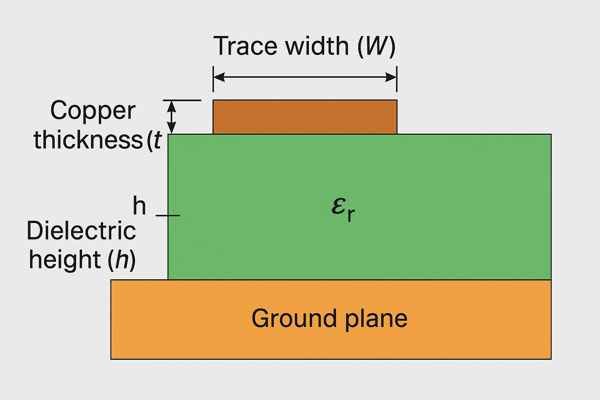
Calculating the correct trace width for a target impedance, typically \(50 \Omega\) in many RF systems, is a core task in PCB design. The characteristic impedance5 (\(Z_0\)) of a microstrip line6 – a trace routed on an outer layer with a ground plane beneath it – is governed by several physical parameters. While complex field solvers provide the most accurate results, well-established approximation formulas exist, such as those from IPC-2141. For practical work, EDA tools or dedicated calculators are indispensable. Standard FR-4 typically has an \(\epsilon_r\) ranging from about \(4.2\) to \(4.8\) at RF frequencies. RF-specific laminates like Rogers RO4350B (with \(\epsilon_r \approx 3.48 \pm 0.05\) as per Rogers Corporation datasheets) offer tighter control. Copper thickness (\(t\)) is usually specified in ounces (e.g., \(0.5 \text{ oz} = 17.5 \text{ µm}\), \(1 \text{ oz} = 35 \text{ µm}\)). A widely cited approximation for microstrip impedance is \(Z_0 \approx \frac{87}{\sqrt{\epsilon_r + 1.41}} \ln\left(\frac{5.98h}{0.8W + t}\right) \Omega\).
Let’s look at how trace width (\(W\)) for a \(50 \Omega\) microstrip might change with different dielectric heights (\(h\)) or materials (\(\epsilon_r\)), assuming \(1 \text{ oz}\) copper (\(t = 0.035 \text{ mm}\)). These values are illustrative and calculated using a standard microstrip impedance formula.
| Parameter Changed | Material \(\epsilon_r\) | Dielectric Height (\(h\)) | Approx. Trace Width (\(W\)) for \(50 \Omega\) | Notes |
|---|---|---|---|---|
| Baseline | \(4.4\) (FR-4) | \(0.2 \text{ mm}\) (\(7.87 \text{ mils}\)) | \(\approx 0.36 \text{ mm}\) (\(14.2 \text{ mils}\)) | Common multilayer stackup |
| Increased Height | \(4.4\) (FR-4) | \(0.5 \text{ mm}\) (\(19.7 \text{ mils}\)) | \(\approx 0.92 \text{ mm}\) (\(36.2 \text{ mils}\)) | Width increases significantly with height |
| Decreased Height | \(4.4\) (FR-4) | \(0.1 \text{ mm}\) (\(3.9 \text{ mils}\)) | \(\approx 0.17 \text{ mm}\) (\(6.7 \text{ mils}\)) | Width decreases for thinner dielectrics |
| RF Substrate | \(3.48\) (Rogers RO4350B) | \(0.2 \text{ mm}\) (\(7.87 \text{ mils}\)) | \(\approx 0.44 \text{ mm}\) (\(17.3 \text{ mils}\)) | Lower \(\epsilon_r\) requires wider trace |
| Thicker 2-layer Board | \(4.4\) (FR-4) | \(1.524 \text{ mm}\) (\(60 \text{ mils}\)) | \(\approx 2.85 \text{ mm}\) (\(112 \text{ mils}\)) | Common for basic prototypes, very wide trace |
(Source for \(\epsilon_r\) of RO4350B: Rogers Corporation datasheet. Other calculations based on Wheeler/IPC formulas.)
As you can see, trace width (\(W\)) is highly sensitive to both the dielectric constant7 (\(\epsilon_r\)) and its height (\(h\)). This is why obtaining accurate stackup information from your PCB fabricator is absolutely critical. During the Tuxedo Keypad project at Honeywell, we had to manage designs across different manufacturing sites, and ensuring consistent stackups for our Wi-Fi module’s RF traces was a constant point of attention to maintain performance.
What PCB feature primarily defines stripline impedance?
Working with internal RF traces where signals are sandwiched between ground planes? Understanding stripline impedance is absolutely crucial for maintaining signal integrity deep within your PCB.
Stripline impedance is primarily defined by the trace width (\(W\)), the total dielectric thickness (\(b\)) between the two ground planes, and the dielectric constant (\(\epsilon_r\)) of the material uniformly surrounding the trace.
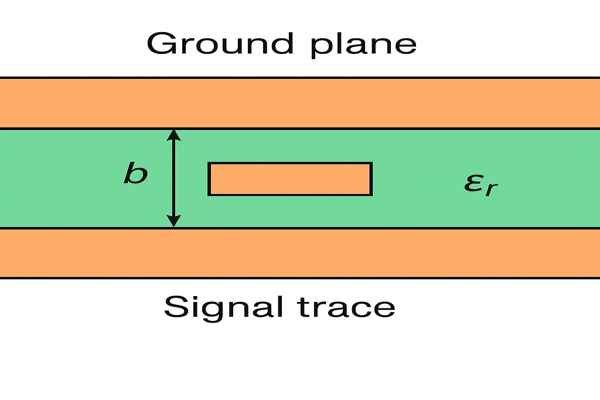
A stripline configuration places the signal trace on an internal layer, with solid ground planes directly above and below it, all embedded within a uniform dielectric material. This structure offers excellent signal isolation. Key parameters determining its characteristic impedance (\(Z_0\)) include the dielectric constant (\(\epsilon_r\)), separation between ground planes (\(b\)), trace width (\(W\)), and trace thickness (\(t\)). For practical calculations, formulas from IPC-2141A8 or EDA tools are recommended.
Here’s an illustrative table showing how stripline trace width (\(W\)) for a \(50 \Omega\) line might vary, assuming \(1 \text{ oz}\) copper (\(t = 0.035\text{mm}\)) and a centered trace.
| Parameter Changed | Material \(\epsilon_r\) | Dielectric Thickness (\(b\)) between planes | Approx. Trace Width (\(W\)) for \(50 \Omega\) | Notes |
|---|---|---|---|---|
| Baseline | \(3.38\) (Rogers RO4003C) | \(0.508 \text{ mm}\) (\(20 \text{ mils}\)) | \(\approx 0.38 \text{ mm}\) (\(15.0 \text{ mils}\)) | Typical RF material and stackup |
| Thicker Dielectric | \(3.38\) (Rogers RO4003C) | \(0.813 \text{ mm}\) (\(32 \text{ mils}\)) | \(\approx 0.63 \text{ mm}\) (\(24.8 \text{ mils}\)) | Width increases with plane separation |
| FR-4 Material | \(4.2\) (FR-4 like) | \(0.508 \text{ mm}\) (\(20 \text{ mils}\)) | \(\approx 0.33 \text{ mm}\) (\(13.0 \text{ mils}\)) | Higher \(\epsilon_r\) requires narrower trace |
| Very Thin Dielectric | \(3.38\) (Rogers RO4003C) | \(0.203 \text{ mm}\) (\(8 \text{ mils}\)) | \(\approx 0.14 \text{ mm}\) (\(5.5 \text{ mils}\)) | Narrow trace for thin core |
(Source for \(\epsilon_r\) of RO4003C: Rogers Corporation datasheet. Calculations based on IPC-2141A formulas for centered stripline.)
It’s crucial to ensure the trace is accurately centered between the ground planes; an offset trace becomes an "offset stripline" with different impedance characteristics. The controlled dielectric environment in stripline generally offers better impedance stability over frequency compared to microstrip.
Which passive components form a basic RF matching network?
Need to bridge the gap between different impedances in your RF design? Often, it’s the humble passive components that are the key to a successful match.
Basic RF matching networks primarily use passive components like inductors (\(L\)) and capacitors (\(C\)). Resistors (\(R\)) are sometimes strategically included, typically for broadband matching or to provide necessary attenuation.
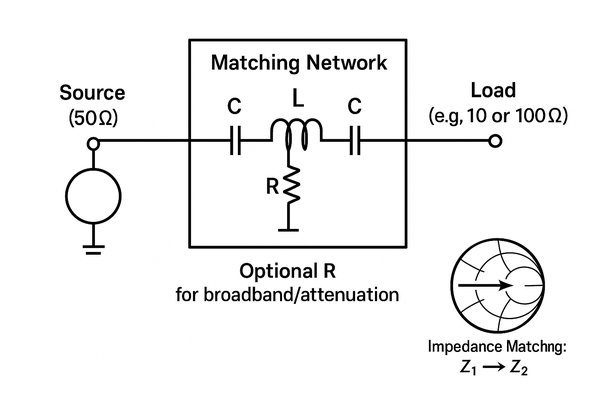
When I’m faced with an impedance mismatch, my first thought often goes to creating a matching network using inductors (\(L\)) and capacitors (\(C\)). These components are reactive, meaning they store energy and can introduce phase shifts to transform impedances. Here’s a summary of their roles:
| Component | Symbol | Impedance (\(Z\)) | Primary Role in Matching | Typical RF Values Example |
|---|---|---|---|---|
| Inductor | \(L\) | \(j\omega L = j2\pi fL\) | Adds positive reactance; impedance increases with frequency. | \(0.5 \text{ nH} – 100 \text{ nH}\) (e.g., \(3.3 \text{ nH}\) @ \(2\text{GHz}\)) |
| Capacitor | \(C\) | \(\frac{1}{j\omega C}\) | Adds negative reactance; impedance decreases with frequency. | \(0.1 \text{ pF} – 100 \text{ pF}\) (e.g., \(1.0 \text{ pF}\) @ \(2\text{GHz}\)) |
| Resistor | \(R\) | \(R\) | Adds real impedance; dissipates power; used for broadbanding or attenuation. | \(10 \Omega – 1 \text{ k}\Omega\) |
Common L-C network topologies include \(L\)-networks, \(\Pi\)-networks, and \(T\)-networks. When selecting these components for RF, parasitics like Self-Resonant Frequency9 (\(SRF\)) for inductors and Equivalent Series Resistance (\(ESR\)) for capacitors are critical. For example, an inductor’s \(SRF\) must be well above the operating frequency. A typical \(10\text{nH}\) chip inductor might have an \(SRF\) of \(6 \text{ GHz}\), making it suitable for applications below that, while a \(100\text{nH}\) inductor might have an \(SRF\) closer to \(1.5 \text{ GHz}\) (values from Murata or Coilcraft datasheets). High-\(Q\) components are preferred for narrow-band, low-loss matching.
How are L-C matching network component values chosen?
Knowing you need an \(L\)–\(C\) network to bridge an impedance gap is the first step. But the critical question follows: how do you actually determine the right inductance (\(L\)) and capacitance (\(C\)) values?
\(L\)–\(C\) matching network component values are chosen using tools like the Smith Chart, analytical formulas derived from network theory (often involving a target \(Q\)-factor), or with the aid of RF simulation software.
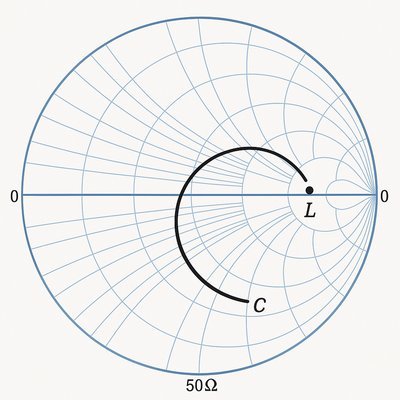
The core objective is to transform a given load impedance (\(Z_L = R_L + jX_L\)) to a desired input impedance (\(Z_S = R_S + jX_S\)), often \(50 \Omega\). The \(L\)-network is the simplest, using two reactive components.
On a Smith Chart10, you normalize the load impedance (e.g., \(z_L = \frac{Z_L}{50\Omega}\)) and plot it. Then, reactive elements are added to move towards the matched point (typically \(1+j0\)). From the normalized reactances, component values are calculated using \(L = \frac{X_L}{2\pi f}\) or \(C = \frac{1}{2\pi f X_C}\).
Analytically, for an \(L\)-network matching real resistances, the Quality Factor11 (\(Q\)) is often a starting point: \(Q = \sqrt{\frac{R_{big}}{R_{small}} – 1}\). The series (\(X_{ser}\)) and shunt (\(X_{sh}\)) reactance magnitudes are \(|X_{ser}| = Q \cdot R_{small}\) and \(|X_{sh}| = \frac{R_{big}}{Q}\).
For instance, to match a \(10 \Omega\) source to a \(50 \Omega\) load at \(1 \text{ GHz}\) with a low-pass \(L\)-network: \(Q = \sqrt{\frac{50}{10} – 1} = 2\). Then \(|X_{serL}| = 2 \cdot 10 = 20 \Omega \Rightarrow L = \frac{20}{2\pi \cdot 1 \cdot 10^9} \approx 3.18 \text{ nH}\). And \(|X_{shC}| = \frac{50}{2} = 25 \Omega \Rightarrow C = \frac{1}{25 \cdot 2\pi \cdot 1 \cdot 10^9} \approx 6.37 \text{ pF}\).
Here’s a table summarizing common L-Network applications for transforming \(R_1\) to \(R_2\):
| Transformation | Series Element | Shunt Element | Filter Type | Notes (\(Q = \sqrt{\frac{R_{high}}{R_{low}} – 1}\)) |
|---|---|---|---|---|
| \(R_{low} \to R_{high}\) | \(L\) (series \(X_S = Q R_{low}\)) | \(C\) (shunt \(X_P = \frac{R_{high}}{Q}\)) | Low-Pass | Places \(L\) in series with \(R_{low}\), \(C\) in shunt with \(R_{high}\) |
| (\(R_{low}\) at input) | \(C\) (series \(X_S = Q R_{low}\)) | \(L\) (shunt \(X_P = \frac{R_{high}}{Q}\)) | High-Pass | Places \(C\) in series with \(R_{low}\), \(L\) in shunt with \(R_{high}\) |
| \(R_{high} \to R_{low}\) | \(C\) (shunt \(X_P = \frac{R_{high}}{Q}\)) | \(L\) (series \(X_S = Q R_{low}\)) | Low-Pass | Places \(C\) in shunt with \(R_{high}\), \(L\) in series with \(R_{low}\) |
| (\(R_{high}\) at input) | \(L\) (shunt \(X_P = \frac{R_{high}}{Q}\)) | \(C\) (series \(X_S = Q R_{low}\)) | High-Pass | Places \(L\) in shunt with \(R_{high}\), \(C\) in series with \(R_{low}\) |
(Reactances \(X_S\), \(X_P\) are magnitudes; \(L = \frac{X}{2\pi f}\), \(C = \frac{1}{X \cdot 2\pi f}\)). These formulas are standard and found in texts like "RF Circuit Design" by Chris Bowick or the ARRL Handbook. RF simulation software (ADS, AWR, QucsStudio) is extremely helpful for optimizing these values and including parasitics, aiming for goals like \(S11 < -20 \text{ dB}\). My experience debugging the PACE evaluation board at Lightelligence under extreme time pressure highlighted how crucial accurate simulation, including parasitics, can be before committing to hardware.
When is a quarter-wave transmission line used for RF matching?
Can a simple PCB trace, just by its length and width, act as a matching element? Absolutely. The quarter-wave transformer is a classic and elegant RF technique I’ve used for specific scenarios.
A quarter-wave transmission line is used for RF matching primarily when transforming one real (purely resistive) impedance to another real impedance. It’s most effective over a relatively narrow frequency band centered at its quarter-wavelength (\(\frac{\lambda_g}{4}\)) frequency (\(f_0\)).
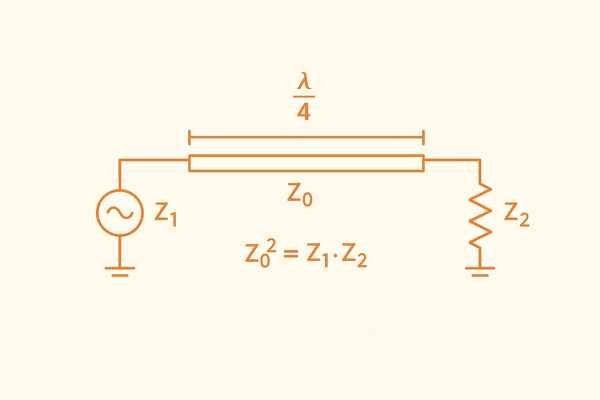
The magic of a quarter-wave transmission line lies in its impedance-inverting property. A segment of transmission line with characteristic impedance \(Z_Q\), terminated with a load \(Z_L\), has an input impedance \(Z_{in} = \frac{Z_Q^2}{Z_L}\). To match a source \(R_S\) to a load \(R_L\), the required \(Z_Q = \sqrt{R_S \cdot R_L}\). The physical length \(L_{phys} = \frac{\lambda_g}{4} = \frac{(\frac{\lambda_0}{\sqrt{\epsilon_{eff}}})}{4}\), where \(\lambda_0 = \frac{c}{f_0}\) is the free-space wavelength and \(\epsilon_{eff}\) is the effective dielectric constant. For instance, at \(f_0 = 2 \text{ GHz}\), \(\lambda_0 = \frac{3 \times 10^8 \text{ m/s}}{2 \times 10^9 \text{ Hz}} = 150 \text{ mm}\). If \(\epsilon_{eff} \approx 3.2\), then \(\lambda_g \approx \frac{150 \text{ mm}}{\sqrt{3.2}} \approx 83.85 \text{ mm}\). So, \(L_{phys} \approx \frac{83.85 \text{ mm}}{4} \approx 20.96 \text{ mm}\).
Here’s a summary of its characteristics:
| Feature | Description |
|---|---|
| Principle | Transforms \(Z_{in} = \frac{Z_Q^2}{Z_L}\). For \(R_S\) to \(R_L\), \(Z_Q = \sqrt{R_S \cdot R_L}\). |
| Advantages | – Low loss (if implemented with low-loss line). – Simple to implement on PCB (no discrete components). – Can be integrated into filter structures. |
| Disadvantages | – Matches real-to-real impedances primarily. – Narrowband performance (typically 10-20% for \(VSWR < 1.5:1\), per Pozar’s "Microwave Engineering"). – Can be physically long at lower RF frequencies (e.g., < 500 MHz). – Fixed transformation ratio once designed. |
| Example | To match \(50\Omega\) to \(100\Omega\): \(Z_Q = \sqrt{50 \cdot 100} \approx 70.7\Omega\). Line length is \(\frac{\lambda_g}{4}\) at \(f_0\). |
Despite limitations, for specific antenna feeds or inter-stage matching where conditions are right, it’s a very effective technique.
How can a shorted RF stub create a specific reactance?
Need to introduce a precise amount of inductance or capacitance into your RF circuit without using a discrete component? A shorted transmission line stub can be an elegant and practical solution on a PCB.
A shorted RF stub, which is simply a transmission line section short-circuited at its far end, presents a purely reactive impedance (either inductive or capacitive) at its input. This reactance is determined by the stub’s characteristic impedance (\(Z_0\)) and its electrical length (\(\theta = \beta l\), where \(\beta = \frac{2\pi}{\lambda_g}\)) relative to the signal wavelength.
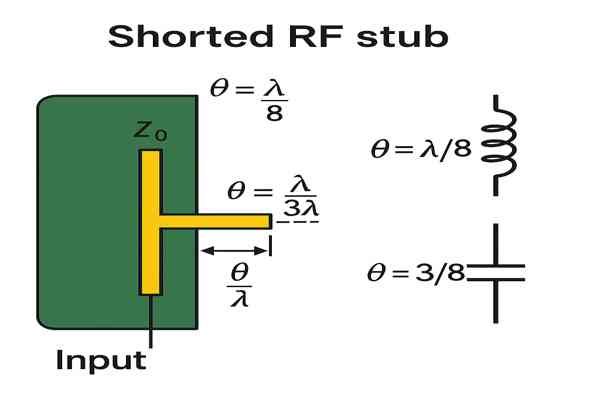
The input impedance of a lossless shorted stub (\(Z_L=0\)) is \(Z_{in} = jZ_0 \tan(\beta l)\). This shows \(Z_{in} = jX_{in}\) where \(X_{in} = Z_0 \tan(\beta l)\). Its behavior is summarized below:
| Stub Length (\(l\)) | Phase Length (\(\beta l\)) | \(\tan(\beta l)\) | Input Impedance (\(Z_{in}\)) | Behaves As | Example Value (for \(Z_0=50\Omega\)) |
|---|---|---|---|---|---|
| \(l = 0\) | \(0\) | \(0\) | \(0\) | Short Circuit | \(0 \Omega\) |
| \(0 < l < \frac{\lambda_g}{4}\) | \(0 \to \frac{\pi}{2}\) | \(0 \to +\infty\) | \(+j0 \to +j\infty\) | Inductor | \(l=\frac{\lambda_g}{8} \Rightarrow +j50\Omega\) |
| \(l = \frac{\lambda_g}{4}\) | \(\frac{\pi}{2}\) | \(+\infty\) | \(+j\infty\) | Parallel Resonant Circuit (Open to series) | Infinite |
| \(\frac{\lambda_g}{4} < l < \frac{\lambda_g}{2}\) | \(\frac{\pi}{2} \to \pi\) | \(-\infty \to 0\) | \(-j\infty \to -j0\) | Capacitor | \(l=\frac{3\lambda_g}{8} \Rightarrow -j50\Omega\) |
| \(l = \frac{\lambda_g}{2}\) | \(\pi\) | \(0\) | \(0\) | Series Resonant Circuit (Short to series) | \(0 \Omega\) |
(Theoretical basis from texts like "Fields and Waves in Communication Electronics" by Ramo, Whinnery, and Van Duzer.) For instance, to create an inductive reactance of \(+j70 \Omega\) at \(2.45 \text{ GHz}\) using a \(Z_0 = 70 \Omega\) stub, we need \(\tan(\beta l) = 1\), so \(\beta l = \frac{\pi}{4}\), meaning \(l = \frac{\lambda_g}{8}\). If \(\epsilon_{eff} \approx 3.0\), \(\lambda_g \approx \frac{122.4 \text{ mm}}{\sqrt{3.0}} \approx 70.7 \text{ mm}\), so \(l \approx \frac{70.7 \text{ mm}}{8} \approx 8.84 \text{ mm}\).
What is a practical challenge in RF matching network PCB layout?
Designing the theoretically perfect matching network on paper or in simulation is one thing. But as I’ve experienced many times, translating that into a physical PCB layout introduces a host of real-world challenges that can detune your carefully calculated network.
A significant practical challenge in RF matching network PCB layout is meticulously managing and minimizing parasitic reactances introduced by component pads, vias, trace segments, and even component spacing. These un-designed parasitics can significantly alter the network’s performance from its intended response.
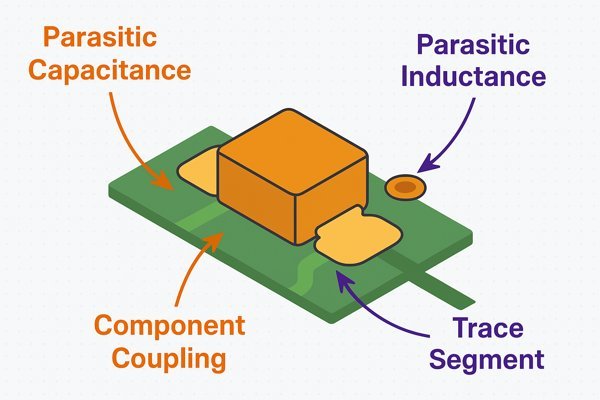
When working with RF frequencies, every millimeter matters. For example, an \(0402\) component pad can add \(0.05 \text{ pF}\) to \(0.2 \text{ pF}\) of capacitance. If your design uses a \(1 \text{ pF}\) capacitor, this is a significant error. A typical via (\(0.2\text{mm}\) drill, \(1.6\text{mm}\) board) might have \(0.4 \text{ nH}\) to \(0.8 \text{ nH}\) of inductance. Short traces add inductance (\(\approx 0.6 – 1.0 \text{ nH/mm}\)) and capacitance (\(\approx 0.05 – 0.1 \text{ pF/mm}\)). If a design needs a \(0.5 \text{ nH}\) inductor, and parasitics add \(0.2 \text{ nH}\), the discrete part should be \(0.3 \text{ nH}\).
Here’s a table summarizing common parasitic elements:
| Parasitic Source | Typical Reactance Type | Estimated Value Range (Illustrative for RF) | Potential Impact | Mitigation Strategy |
|---|---|---|---|---|
| SMD Component Pad (e.g., \(0402\)) | Shunt Capacitance | \(0.05 – 0.2 \text{ pF}\) (to ground) | Detunes network, shifts resonant frequencies | Smaller pads, thicker dielectric, EM simulation |
| Series Inductance | \(0.1 – 0.3 \text{ nH}\) (along pad length) | Adds series \(L\), shifts phase | Shorter pads, wider pads (can increase \(C\)) | |
| Via (e.g., \(0.2\text{mm}\) drill, \(1.6\text{mm}\) board) | Series Inductance | \(\approx 0.4 – 0.8 \text{ nH}\) | Limits grounding effectiveness for shunt parts | Multiple vias ("via stitching"), shorter/wider vias, minimize use |
| Shunt Capacitance | \(\approx 0.1 – 0.3 \text{ pF}\) (to planes, via anti-pad) | Can be significant in dense designs | Proper anti-pad sizing | |
| Short Interconnecting Trace | Series Inductance | \(\approx 0.6 – 1.0 \text{ nH/mm}\) | Adds unwanted series \(L\) | Minimize trace lengths, use coplanar structures carefully |
| Shunt Capacitance | \(\approx 0.05 – 0.1 \text{ pF/mm}\) (to ground) | Adds unwanted shunt \(C\) | Route over thicker dielectric if possible, minimize length | |
| Component-to-Component Spacing | Mutual Coupling (\(L, C\)) | Variable, depends on proximity, orientation, frequency | Unintended signal paths, detuning | Maintain adequate spacing, orthogonal placement if needed |
(Values are estimates; actuals depend heavily on specific geometry, materials, and frequency. Refer to E. Bogatin’s "Signal and Power Integrity – Simplified" for detailed discussions.)
If these parasitics are not anticipated, the matching network will likely require extensive bench tuning. For critical designs, especially above \(1-2 \text{ GHz}\), I always advocate for 3D electromagnetic (EM) simulation12 of the layout (Ansys HFSS, CST Studio Suite) to capture these effects accurately.
How is RF matching network effectiveness practically tested?
Your RF matching network has been meticulously designed with calculations or simulation, and the PCB has been fabricated and assembled. But how do you actually confirm, with real hardware, that it’s performing as intended?
RF matching network effectiveness is practically tested using a Vector Network Analyzer (VNA). The VNA measures key S-parameters, primarily the input return loss (\(S11\)) and sometimes the transmission gain/loss (\(S21\)), across the network’s operational frequency band.
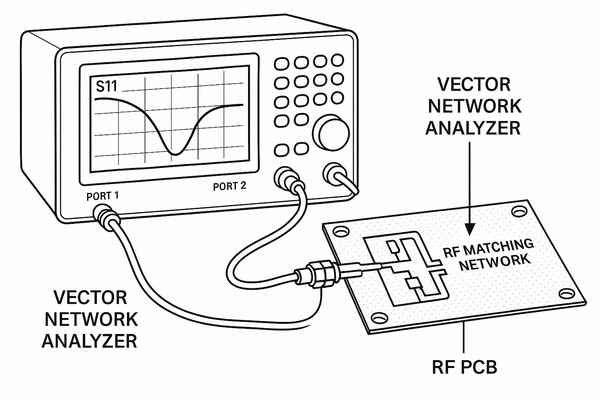
The Vector Network Analyzer (VNA)13 is the cornerstone of RF characterization. After careful calibration (SOLT – Short, Open, Load, Thru), the VNA measures S-parameters14. For example, an \(S11\) of \(-10 \text{ dB}\) means 10% power is reflected (\(VSWR \approx 1.92:1\)). Often, a target is \(S11 < -15 \text{ dB}\) (\(3.2\text{\%}\) power reflected, \(VSWR \approx 1.43:1\)) or even \(S11 < -20 \text{ dB}\) (\(1\text{\%}\) power reflected, \(VSWR \approx 1.22:1\)). The insertion loss15 (\(S21\)) should be minimized (e.g., \(< 0.5 \text{ dB}\)).
| S-Parameter | Name | Description | Ideal Value for Good Match (Passive Network) | Common Target (\(\text{dB}\) or ratio) |
|---|---|---|---|---|
| \(S11\) | Input Return Loss | Ratio of reflected power to incident power at Port 1. Lower is better. | \(-\infty \text{ dB}\) | \(< -10 \text{ dB}\), pref. \(< -15 \text{ dB}\) |
| \(S21\) | Forward Gain/Loss | Ratio of power at Port 2 to power at Port 1. For passive match, this is loss. | \(0 \text{ dB}\) | \(< 0.5 \text{ dB}\) (loss) |
| \(S22\) | Output Return Loss | Ratio of reflected power to incident power at Port 2 (if applicable). | \(-\infty \text{ dB}\) | \(< -10 \text{ dB}\) |
| \(VSWR\) | Voltage Standing Wave Ratio | Derived from \(S11\) (\(VSWR = \frac{1 + |S11|}{1 – |S11|}\)). Lower is better. | \(1:1\) | \(< 2:1\), pref. \(< 1.5:1\) |
My work on the Tuxedo Keypad’s Wi-Fi module involved countless hours on the VNA, tweaking matching networks for antennas and filters to meet stringent FCC and CE certification requirements. Leading VNA manufacturers include Keysight, Rohde & Schwarz, and Anritsu.
Does solder mask thickness influence controlled RF impedance?
In the meticulous world of RF PCB design, I’ve learned that even seemingly minor details can have an impact. So, a common question arises: could something as ubiquitous as the solder mask layer actually affect your carefully designed controlled impedance traces?
Yes, solder mask thickness and its dielectric constant (\(\epsilon_r\)) do influence controlled RF impedance, particularly for microstrip lines. The solder mask alters the effective dielectric constant (\(\epsilon_{eff}\)) in the region immediately surrounding the trace, thereby changing its impedance.
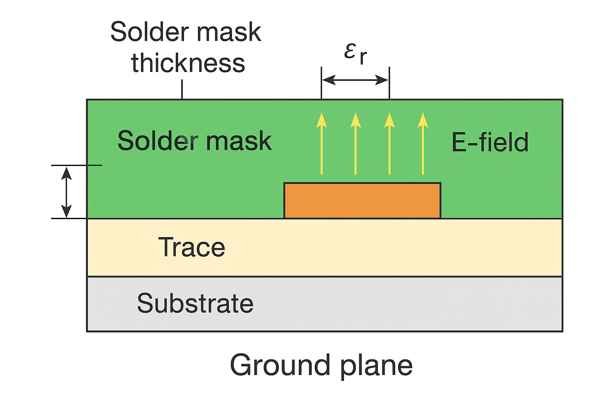
Solder mask (LPI typical \(\epsilon_r \approx 3.0 – 4.0\), thickness \(\approx 0.5 – 1.5 \text{ mils}\) over traces, per IPC-SM-840D) replaces air (\(\epsilon_r \approx 1\)) above a microstrip trace. This increases the overall \(\epsilon_{eff}\), which in turn decreases the characteristic impedance (\(Z_0 \propto \frac{1}{\sqrt{\epsilon_{eff}}}\)).
Here’s how different aspects of solder mask can influence a microstrip line designed for \(50\Omega\) (bare copper):
| Solder Mask Parameter Change | Typical Range/Value | Effect on Microstrip \(Z_0\) | Reason | Estimated \(Z_0\) Change (from bare \(50\Omega\)) |
|---|---|---|---|---|
| Addition of Standard Solder Mask | \(1 \text{ mil}\) (\(25.4\text{µm}\)) thick, \(\epsilon_r \approx 3.5\) | Decrease | Increases overall \(\epsilon_{eff}\) as air (\(\epsilon_r=1\)) is replaced by mask (\(\epsilon_r > 1\)) | \(1 – 3 \Omega\) lower (e.g., to \(47-49\Omega\)) |
| Increase in Solder Mask Thickness (over trace) | From \(0.5 \text{ mil}\) to \(1.5 \text{ mil}\) | Further Decrease | More dielectric material with \(\epsilon_r > 1\) influences the fringing fields | Additional \(\approx 0.5 – 1 \Omega\) decrease |
| Increase in Solder Mask \(\epsilon_r\) | From \(\epsilon_r=3.0\) to \(\epsilon_r=4.0\) | Further Decrease | Higher \(\epsilon_r\) of mask material contributes more to increasing \(\epsilon_{eff}\) more | Additional \(\approx 0.5 – 1 \Omega\) decrease |
| Removal of Solder Mask (Solder Mask Opening) | N/A (bare copper) | Increase (back to design) | Reduces \(\epsilon_{eff}\) by exposing trace to air | Recovers original design impedance |
(Estimates are illustrative and vary with specific trace geometry and substrate. Accurate modeling requires EM simulators or specialized calculators from sources like Polar Instruments).
For critical RF designs (e.g., \(> 5 \text{ GHz}\) or tight \(Z_0\) tolerance), solder mask effects must be included in simulations. For striplines, the effect is generally negligible as the field is contained internally.
Conclusion
In my experience, effective RF impedance matching is absolutely fundamental. It’s the key to ensuring maximum power transfer, preserving vital signal integrity, and preventing data corruption in today’s demanding high-frequency circuits.
-
The signal-to-noise ratio is vital for system performance. Learn more about its impact on RF systems to enhance your designs. ↩
-
The reflection coefficient is key to understanding signal loss and ensuring efficient RF system performance. ↩
-
Understanding VSWR is crucial for optimizing power transmission and minimizing signal distortion in RF systems. ↩
-
Intersymbol interference can severely degrade data integrity in digital communications, making it essential to understand and mitigate. ↩
-
Understanding characteristic impedance is crucial for designing effective RF circuits and ensuring signal integrity. ↩
-
Exploring microstrip lines will enhance your knowledge of RF design and help you optimize PCB layouts for better performance. ↩
-
Learning about dielectric constants will aid in selecting materials that improve signal integrity and overall PCB performance. ↩
-
Explore IPC-2141A for guidelines on trace width and impedance calculations in PCB design. ↩
-
Learning about Self-Resonant Frequency helps in selecting the right components for high-frequency applications. ↩
-
Discover how to effectively use a Smith Chart for impedance matching, a crucial skill for RF engineers and designers. ↩
-
Learn about the Quality Factor and its significance in RF circuits, which is essential for optimizing performance in impedance matching. ↩
-
3D EM simulation helps capture parasitic effects accurately, ensuring better performance in high-frequency designs. ↩
-
Understanding the VNA is crucial for RF characterization and optimizing network performance. Explore this link for in-depth insights. ↩
-
S-parameters are essential for analyzing RF components. This resource will deepen your understanding of their significance in design. ↩
-
Insertion loss is a key factor in RF performance. Learn more about its impact and how to minimize it for better results. ↩