Struggling with unpredictable RF circuits? Performance issues derailing your project? Discover proven methods to quickly find and fix those elusive RF PCB problems.
Practical RF PCB troubleshooting involves a "Divide and Conquer" strategy, using tools like spectrum analyzers and VNAs to systematically isolate issues from system-level assessments down to specific components or layout flaws.

Finding the root cause of RF PCB issues can feel like searching for a needle in a haystack. But with the right approach, it becomes a manageable process. The most robust approach to RF PCB troubleshooting is an iterative "Divide and Conquer" methodology. This begins with non-invasive, system-level spectral and power integrity assessments to broadly categorize the issue (e.g., no output, spurious emissions, signal integrity degradation). It then systematically narrows the search to specific PCB sections or components using a combination of frequency-domain tools (Spectrum Analyzer, Vector Network Analyzer with near-field probes) for signal characteristic issues, and time-domain tools (Oscilloscope with Time Domain Reflectometry) for physical path and impedance anomalies. The key is not just using these tools, but strategically sequencing their application and correlating their findings to pinpoint the root cause, distinguishing between design flaws, component failures, or manufacturing defects. This is often an iterative process; findings from one test will inform the strategy for subsequent tests. Now, let’s dive into the essential gear.
What Essential Test Gear is Needed to Debug RF PCB Problems?
Feeling ill-equipped for RF debugging? Unsure which instruments are vital? Investing in the right tools is the first step towards efficient RF PCB problem-solving.
Essential RF PCB debug gear includes a spectrum analyzer, vector network analyzer (VNA), oscilloscope (preferably with high bandwidth), signal generator, power meter, multimeter, and near-field probes.
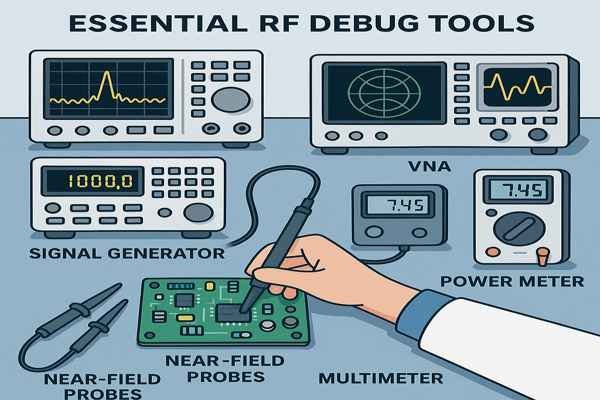
Having the right set of tools is fundamental when you’re trying to figure out what’s wrong with an RF printed circuit board. Without them, you’re essentially working blind. I learned early in my career that trying to skimp on test equipment for RF work is a false economy; it just leads to wasted time and frustration. Each piece of equipment plays a distinct role in painting a complete picture of your circuit’s behavior.
Key Instruments and Their Roles
Here’s a rundown of the core instruments I always make sure to have access to, summarized in a table for clarity:
| Instrument | Primary Use in RF Debugging | Key Specification Example (Illustrative) |
|---|---|---|
| Spectrum Analyzer1 | View signal power vs. frequency; identify spurs, harmonics | Frequency Range: \(\text{up to } 6 \text{ GHz or higher}\); Dynamic Range: \(>70 \text{ dB}\) |
| Vector Network Analyzer (VNA)2 | Measure S-parameters (\(S_{11}\), \(S_{21}\)); characterize components/paths | Ports: 2-port; Freq. Range: Matches application |
| Oscilloscope3 | View signals in time-domain; TDR for impedance analysis | Bandwidth: \(>1 \text{ GHz}\) (RF use); TDR/FFT options |
| Signal Generator | Provide known, stable RF test signals | Freq. Range: Matches application; Good Purity |
| RF Power Meter | Accurately measure RF power levels | Frequency/Power Range: Matches application |
| Near-Field Probes | Localize EMI sources or RF leakage (H-field & E-field) | Probe Kit: Various sizes/types |
| Digital Multimeter (DMM) | Check DC bias voltages, currents, continuity | Standard accuracy and ranges |
Beyond this list, specialized equipment like noise figure analyzers or phase noise test sets might be needed for very specific or high-performance applications. I remember one project where we were redesigning a Wi-Fi module, and we were plagued by intermittent signal dropouts. We suspected an impedance mismatch on the antenna feedline, but without a VNA, it was pure guesswork. Once we managed to borrow a VNA, we quickly saw a horrible \(S_{11}\) (return loss) plot, pinpointing a poorly tuned antenna matching network. That tool saved us days of blind alleys. The VNA indicated coverage up to \(50 \text{ GHz}\) for some models, while typical high-bandwidth oscilloscopes might offer bandwidths \(>1 \text{ GHz}\), with some reaching \(70 \text{ GHz}\).
How Does a VNA Help Find RF PCB Impedance Mismatches?
Signal reflections causing havoc in your RF design? Suspect impedance mismatches but can’t pinpoint them? A VNA is your best friend for this particular gremlin.
A VNA measures the \(S_{11}\) parameter (return loss), directly indicating how much power is reflected due to impedance mismatches. A high \(S_{11}\) value (closer to \(0 \text{ dB}\)) at a specific frequency points to a mismatch.
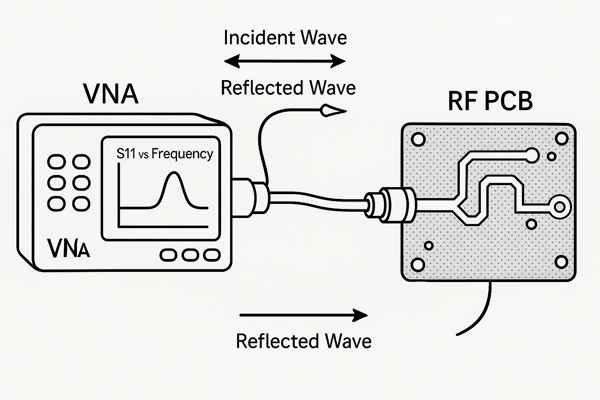
Impedance mismatches are a constant concern in RF design. If the impedance of a transmission line doesn’t perfectly match the impedance of the load (like an antenna or the input of an amplifier), some of the RF energy will be reflected. This reflected energy can cause all sorts of problems: reduced power transfer, signal distortion, and even damage to components. A Vector Network Analyzer is the go-to tool for quantifying these mismatches.
Interpreting VNA Measurements for Mismatches
The \(S_{11}\) parameter, or return loss, is key. The VNA sends a signal and measures what’s reflected. Here’s how \(S_{11}\) values generally translate:
| \(S_{11}\) Value (dB) | Reflection Coefficient (Magnitude) | Approx. % Power Reflected | General Interpretation |
|---|---|---|---|
| \(0 \text{ dB}\) | \(1\) | \(100\%\) | Total reflection (e.g., open or short circuit) |
| \(-3 \text{ dB}\) | \(0.707\) | \(50\%\) | Very poor match |
| \(-6 \text{ dB}\) | \(0.5\) | \(25\%\) | Poor match |
| \(-10 \text{ dB}\) | \(0.316\) | \(10\%\) | Often acceptable minimum for many systems |
| \(-15 \text{ dB}\) | \(0.178\) | \(3.2\%\) | Good match |
| \(-20 \text{ dB}\) | \(0.1\) | \(1\%\) | Excellent match |
| \(-\infty \text{ dB}\) | \(0\) | \(0\%\) | Perfect match (theoretical) |
Note: These values are general guidelines. Specific system requirements may vary. A perfect match would mean no reflection, so \(S_{11}\) would be \(-\infty \text{ dB}\).
For many RF circuits, an \(S_{11}\) value better (more negative) than \(-10 \text{ dB}\) is often considered acceptable, as indicated in texts like "Microwave Engineering" by David M. Pozar. High-performance systems might demand \(S_{11}\) to be \(-15 \text{ dB}\) (about \(3.2\%\) reflection) or even \(-20 \text{ dB}\) (\(1\%\) reflection). For example, antenna matching often targets an \(S_{11} < -10 \text{ dB}\) across the entire operational frequency band. VNAs also offer Smith Chart displays, a graphical tool plotting complex impedance. The chart’s center is your target impedance (usually \(50 \Omega\)), and deviations visually highlight the nature of the mismatch. By sweeping across frequencies, the VNA shows how the match varies, crucial for broadband designs. I recall a project developing a \(2.4 \text{ GHz}\) radio module. The output power was significantly lower than we simulated. The VNA’s \(S_{11}\) measurement immediately showed an \(\approx -3 \text{ dB}\) match at our operating frequency. A wrong inductor in the matching network was the culprit. Swapping it brought \(S_{11}\) down to \(-15 \text{ dB}\).
What Visual Checks Can Identify Potential RF PCB Faults?
Overlooking simple fixes for RF issues? Sometimes the problem is right before your eyes. Don’t underestimate the power of a thorough visual inspection before you even power anything up.
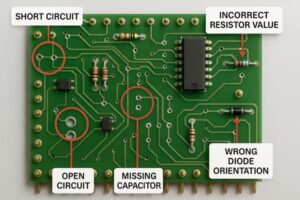
Visual checks can reveal poor solder joints (especially on RF connectors and components), incorrect component placement/orientation, damaged traces or pads, missing components, or signs of overheating (discoloration).
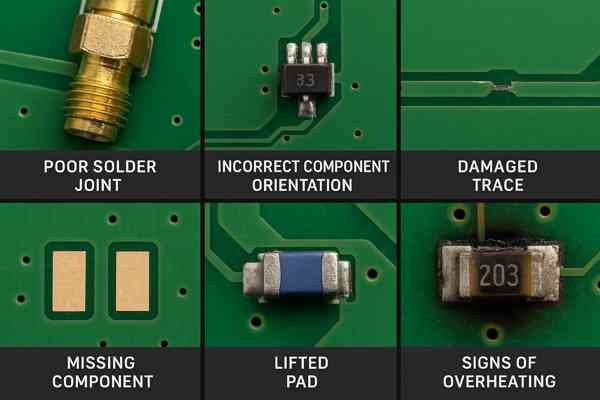
It might sound too basic, especially when dealing with complex RF circuits, but a careful visual inspection is often the first and surprisingly effective troubleshooting step. I’ve seen many hours wasted on complex measurements only to find the issue was something a good look with a microscope could have caught in minutes.
Common Visual Fault Indicators
When you’re inspecting an RF PCB, especially a new prototype or one that’s started misbehaving, specific anomalies can point to underlying RF problems. Here’s what to look for:
| Visual Anomaly | Potential RF Problem Indicated | Example |
|---|---|---|
| Poor Solder Joints | Open circuits, high resistance, intermittent connections, impedance changes | Dull/cracked joints on an SMA connector, solder bridge on a filter IC |
| Incorrect Component | Wrong value/type, wrong orientation leading to malfunction | Wrong capacitor value in a matching network, diode installed backward |
| Damaged Traces/Pads | Open circuits, shorts, impedance variations, signal integrity issues | Scratched microstrip trace, lifted pad on a QFN component |
| Missing Components | Incomplete circuit, open connections | An unpopulated series capacitor in the signal path |
| PCB Contamination/Residue | Leakage paths, impedance changes (especially if hygroscopic) | Excessive flux residue around sensitive RF components |
| Signs of Overheating/Stress | Component failure, thermal design issues, shorts, overloads | Discolored PCB material near a power amplifier, burnt resistor |
The IPC-A-610 standard4 ("Acceptability of Electronic Assemblies") provides detailed visual criteria for solder joint quality and other assembly aspects. Pay extra attention to RF connectors and fine-pitch components. On one prototype batch for an RF filter module, performance was way off. A close look under a microscope revealed tiny solder bridges between the pads of a QFN-packaged filter IC – a classic manufacturing defect easily missed by a quick glance but devastating to RF performance.
How are Unwanted RF Oscillations in Amplifiers Typically Detected?
Is your RF amplifier behaving erratically or generating strange signals? Unwanted oscillations could be the culprit, silently wrecking performance or even causing damage. How do you catch them in the act?
Unwanted RF oscillations are typically detected using a spectrum analyzer. Look for unexpected signals (spurious emissions) at frequencies unrelated to the input signal, often at the amplifier’s output or even on its power supply lines.
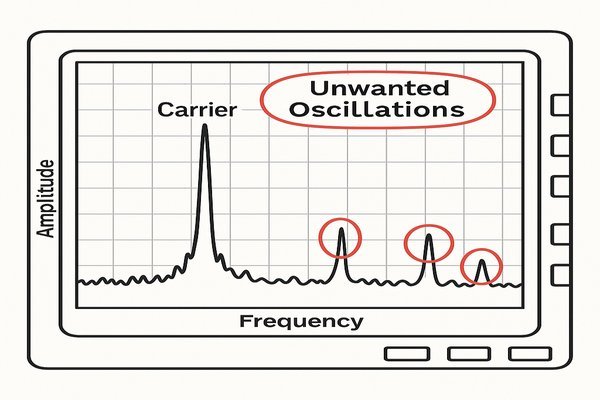
RF amplifiers are designed to amplify signals, but sometimes, due to issues with layout, grounding, impedance matching, or component choice, they can become unstable and start generating their own signals – they oscillate. These oscillations can be at any frequency, not necessarily related to your desired operating frequency, and they can wreak havoc.
Detecting Amplifier Oscillations
Here’s how I typically hunt for these unwanted signals. A spectrum analyzer is your primary tool, but other indicators can also point to oscillations:
| Detection Method/Indicator | Description | Tool(s) Used |
|---|---|---|
| Spectrum Analysis (Output) | Look for unexpected signals/spurs with no RF input, or with RF input that are not harmonics/IMD products. | Spectrum Analyzer, Attenuators |
| Spectrum Analysis (Supply) | Check for RF signals on \(V_{cc}\)/\(V_{dd}\) lines using a probe. | Spectrum Analyzer, Near-field Probe / High-Z Probe + DC Block |
| Output Power Behavior | Desired signal is unstable, jumps in power, or is significantly lower than expected. | Power Meter, Spectrum Analyzer |
| DC Current Draw | Amplifier draws excessive or fluctuating DC current compared to datasheet specs or normal operation. | Multimeter (Ammeter), Power Supply Readout |
| Thermal Behavior | Amplifier gets unusually hot, even with no or small input signal. | IR Thermometer, Feel (carefully!) |
When using a spectrum analyzer, always use appropriate attenuation at its input. First, power the amplifier with no RF input; an unstable amp might oscillate on its own. Then, apply a small input signal and vary its power and frequency, watching for errant spurs. A common scenario I’ve encountered is a Low Noise Amplifier5 (LNA) oscillating because of poor grounding or inadequate power supply decoupling. The spectrum analyzer would show a strong, unexpected peak sometimes far from the LNA’s operating band. Good stability analysis (e.g., calculating Rollett stability factor6 \(K\), where \(K > 1\) for stability, and the auxiliary stability factor \(B_{1f}\), where \(B_{1f} > 0\), from S-parameters during design, as per "RF Circuit Design" by Chris Bowick) can help prevent these issues.
What is a Simple Way to Locate an EMI Source on an RF PCB?
Annoying EMI messing with your RF circuit’s performance? Struggling to find where that interference is coming from on a crowded PCB? There’s a straightforward method to play detective.
A simple way to locate an EMI source on an RF PCB is to use a near-field probe (H-field or E-field) connected to a spectrum analyzer. Scan the probe over the PCB surface to find areas with the highest emission at the problematic frequency.
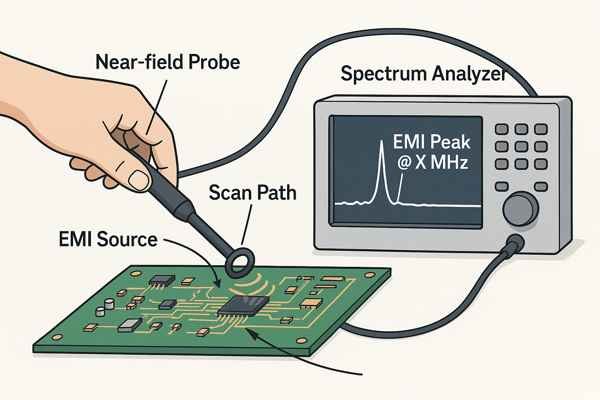
Electromagnetic Interference (EMI) can be a nightmare in RF systems. Unwanted signals from one part of your board can couple into sensitive RF paths. Near-field probes are excellent for sniffing out these EMI culprits.
Pinpointing EMI with Near-Field Probes
Different probes are sensitive to different types of fields:
| Probe Type | Sensitive To | Typical Use Cases for EMI Detection on PCBs |
|---|---|---|
| H-field (Loop Probe) | Magnetic Fields (Currents) | High-current traces (power lines, SMPS loops), noisy inductors, current loops. |
| E-field (Stub Probe) | Electric Fields (Voltages) | High-voltage points, unterminated trace ends, fast-switching digital signals. |
The procedure involves connecting the probe to a spectrum analyzer tuned to the interference frequency. Use a narrow resolution bandwidth (e.g., \(1-10 \text{ kHz}\)) to clearly see the signal. Hold the probe a few millimeters from the PCB and slowly scan across components, traces, and cables. The location where the signal strength peaks on the analyzer is likely the source or a strong radiator. I once had a digital control signal leaking into an RF path. By slowly moving an H-field probe, the spectrum analyzer showed a peak right over the microcontroller’s clock line and a nearby via that was coupling the noise. This helped us target our shielding and grounding improvements effectively.
When are RF Near-Field Probes Most Useful During Debugging?
Got elusive RF problems that defy standard measurements? Wondering if near-field probes are just for EMI pre-compliance checks? They are actually very versatile diagnostic tools for much more than just basic EMI hunting.
RF near-field probes are most useful for localizing EMI sources, identifying unwanted signal coupling paths, diagnosing shielding effectiveness, and qualitatively tracing RF leakage on a PCB without direct electrical contact.
While hunting for EMI sources is a primary application, RF near-field probes offer a range of diagnostic capabilities that can be incredibly helpful during the debugging process for various RF issues, not just formal compliance testing. Their non-contact nature is a huge advantage.
Versatile Applications of Near-Field Probes
Here’s how these probes can extend your diagnostic reach:
| Application Area | How Near-Field Probes Help |
|---|---|
| EMI Source Localization | Pinpoint specific components or traces radiating problematic frequencies. |
| Signal Path Tracing (Qualitative) | Follow a signal along a trace or through components to find breaks or unexpected signal stops. |
| Investigating Coupling/Crosstalk | Identify how and where signals are leaking from an aggressor trace/component to a victim. |
| Shielding Effectiveness | Get a relative measure of how well an RF shield or enclosure is attenuating signals (check seams/apertures). |
| Resonance Detection | Identify unintended resonant structures (e.g., ungrounded metal) radiating energy. |
| Harmonic Sniffing | Locate which components are generating strong harmonics of a fundamental signal. |
In a densely packed RF module, we had an issue where an oscillator’s signal was mysteriously appearing in another section. Using a small H-field probe, we traced the leakage path not through a conductive trace, but through radiated coupling to an adjacent unshielded inductor, which then re-radiated it. This kind of "airborne" coupling would have been very difficult to identify with contact probes alone. While a near-field probe won’t give you a precise \(S_{21}\) measurement like a VNA, it’s invaluable for these qualitative checks. While formal tests for things like shielding effectiveness (e.g., per MIL-STD-461G) are more involved, near-field probes give you quick, valuable insights during development.
What Does Unusually High RF Signal Loss Often Suggest?
Is your RF signal significantly weaker than you calculated or simulated? Losing precious decibels somewhere in the signal chain can cripple performance. Unusually high RF signal loss often points to a few specific types of problems.
Unusually high RF signal loss often suggests an impedance mismatch, a faulty component (e.g., bad attenuator, damaged amplifier), defective connectors or cables, or excessive losses in the PCB transmission lines themselves.
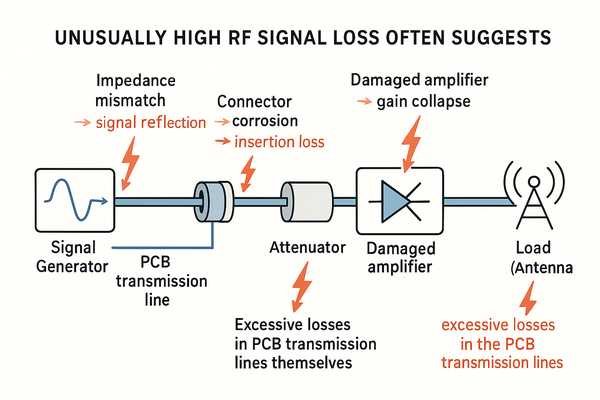
When you’re expecting a certain signal level and it’s much lower – say, \(3 \text{ dB}\), \(6 \text{ dB}\), or even \(>10 \text{ dB}\) down – it’s a clear sign something is wrong. This attenuation can occur for several reasons.
Diagnosing Excessive Attenuation
Here’s a breakdown of common culprits and how to investigate them:
| Potential Cause of High Loss | Key Diagnostic Indicators/Tools |
|---|---|
| Impedance Mismatch7 | High \(S_{11}\) (return loss) on VNA; signal reflections. \(S_{21}\) (insertion loss) also poor. |
| Faulty Passive Component | Component measures out of spec (e.g., attenuator, filter); open/short from bad solder joint. VNA, LCR meter. |
| Faulty Active Component | Low gain, no output from amplifier/mixer; incorrect DC bias. VNA, Spectrum Analyzer, DMM. |
| Defective Connectors/Cables | Intermittent signal, high loss when flexed; physical damage. VNA (cable test), visual inspection. |
| PCB Transmission Line Issues | Incorrect trace impedance (wrong \(E_{r}\)/width/height); poor trace quality; via losses. VNA (TDR), careful layout review. |
| Incorrect Component Value/Placement | Wrong part populated, causing mismatch or signal blockage. Visual inspection, BOM check, LCR meter. |
For instance, if \(S_{11}\) is only \(-3 \text{ dB}\), about \(50\%\) of the power is reflected, leading to at least a \(3 \text{ dB}\) loss. A typical RG58 coaxial cable might have losses around \(0.5 \text{ dB to } 1 \text{ dB per meter at } 1 \text{ GHz}\) (check manufacturer specs like Belden or CommScope), but a damaged one could be far worse. We once saw a \(10 \text{ dB}\) drop in signal strength through a filter stage. A VNA check showed terrible insertion loss. The culprit? A tiny crack in a ceramic filter, almost invisible to the naked eye, likely caused by board flex during assembly. This highlights the need to combine instrumental analysis with careful physical inspection.
How Can a Single Faulty RF Component Be Isolated Systematically?
Know there’s a bad RF part somewhere in the chain but unsure how to find that one needle in the haystack? Randomly replacing components is slow, costly, and can sometimes introduce new problems. A systematic approach is essential.
Isolate a single faulty RF component by systematically measuring signals at the input and output of each component in the suspected signal path, using a spectrum analyzer or VNA. This "signal tracing" or "divide and conquer" method narrows it down.
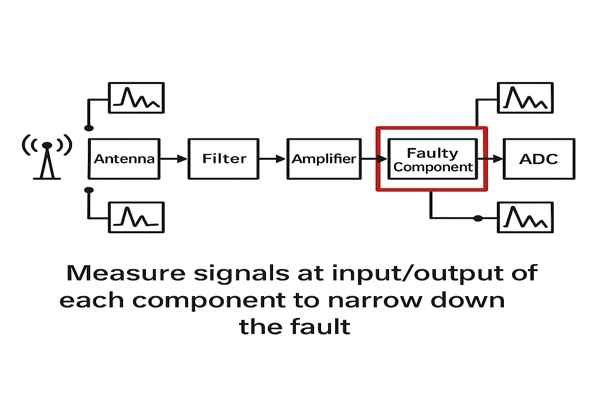
When you’ve determined that a specific section of your RF board isn’t performing and you suspect a single component is the culprit, you need a methodical way to pinpoint it. Randomly swapping parts is rarely efficient.
Techniques for Component Isolation
Here are the strategies I rely on:
| Isolation Technique | Brief Description | Common Tools |
|---|---|---|
| Signal Tracing | Measure signal at input and output of each component in the path sequentially. | Spectrum Analyzer, VNA, RF Probe, Oscilloscope (sometimes) |
| "Divide and Conquer" | Split the signal path in half and test the midpoint; repeat on the faulty section. | Spectrum Analyzer, VNA, RF Probe |
| Component Swapping | Replace suspect component with a known good one (use with caution). | Soldering Station, Known Good Component |
| Thermal Method | Use localized heat/cold to see if component behavior changes. | Freezer Spray, Heat Gun (controlled) |
| DC Bias Checks | Verify correct DC voltages/currents for active components. | Digital Multimeter (DMM) |
| Bypass/Removal | Temporarily remove or bypass a non-essential suspect component (e.g., a filter). | Soldering Station, Jumper Wires (carefully) |
The "Signal Tracing" method is very direct. If the signal is good going into a component but bad coming out, that component or its immediate connections are suspect. I recall debugging a complex RF receiver front-end that suddenly had no output signal. The overall gain was supposed to be around \(30 \text{ dB}\), but we were getting nothing. By systematically probing with a spectrum analyzer, starting from the antenna input, we checked the output of the LNA (signal was good), then the output of the first bandpass filter (still good), then the input to the mixer IC (signal present and strong). However, at the IF output of the mixer, there was absolutely nothing – just noise. All the DC bias voltages on the mixer IC pins measured correct according to the datasheet. This strongly pointed to an internal failure within the mixer IC itself. We carefully replaced the mixer, and the receiver immediately sprang back to life with the full expected gain. Using a VNA to check \(S_{21}\) across sections can also be very effective. Always be cautious with component swapping, as the root cause (like a short) could damage the new part if not addressed first.
Can Varying Temperature Help Find Intermittent RF PCB Faults?
Plagued by RF problems that come and go seemingly at random? These intermittent faults are among the most frustrating to track down. Could strategic temperature changes be your ally in this fight?
Yes, varying temperature using a thermal chamber, freezer spray, or a controlled heat gun can often help find intermittent RF PCB faults. Components or solder joints that are marginal and failing at temperature extremes will reveal themselves under such stress.
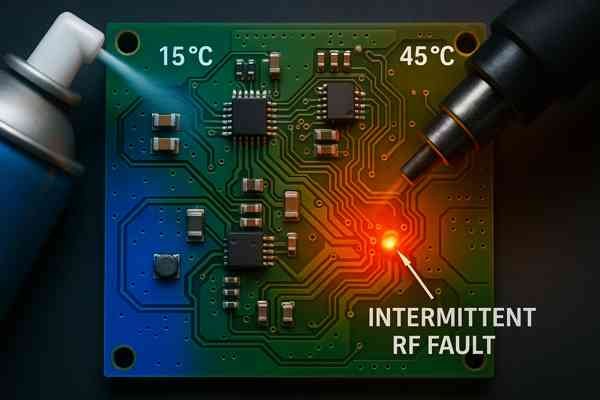
Intermittent problems are the bane of any hardware engineer. One very effective technique for provoking these faults into appearing more consistently is to use controlled temperature variation.
Using Thermal Cycling for Debugging
Different thermal methods can help isolate these tricky issues:
| Thermal Method | Description | Typical Application/Benefit for Intermittents |
|---|---|---|
| Freezer Spray8 | Rapidly cools a small, localized area (e.g., down to \(-50^{\circ}\text{C}\)). | Identifies components/solder joints failing open or changing value when cold. |
| Heat Gun (Controlled) | Gently warms a localized area (e.g., \(50-70^{\circ}\text{C}\), monitor carefully). | Reveals components/solder joints failing short or drifting when hot. |
| Thermal Chamber | Cycles the entire PCB/system through a defined temperature range. | Catches systemic issues or faults that appear after prolonged thermal soak/cycling. |
The principle is that component characteristics and physical connections can change with temperature. A hairline crack in a solder joint might open when cold and close when hot, or vice-versa. Semiconductor performance can also drift significantly at temperature extremes. When using these methods, apply the temperature change and monitor the RF performance for any correlation. We had a GPS module that would lose lock randomly. A thermal chamber showed it consistently failed when cycled between \(-10^{\circ}\text{C and } +60^{\circ}\text{C}\), specifically failing when \(< 0^{\circ}\text{C}\). Using freezer spray, we then isolated the issue to a specific crystal oscillator whose frequency was drifting too much at low temperatures. Remember to use caution with heat guns to avoid exceeding component temperature ratings (check datasheets; common maximums are \(85^{\circ}\text{C}\) or \(125^{\circ}\text{C}\)), and be mindful of condensation with freezer spray. MIL-STD-810H9 provides formal methods for environmental testing, such as cycling from \(-20^{\circ}\text{C to } +70^{\circ}\text{C}\).
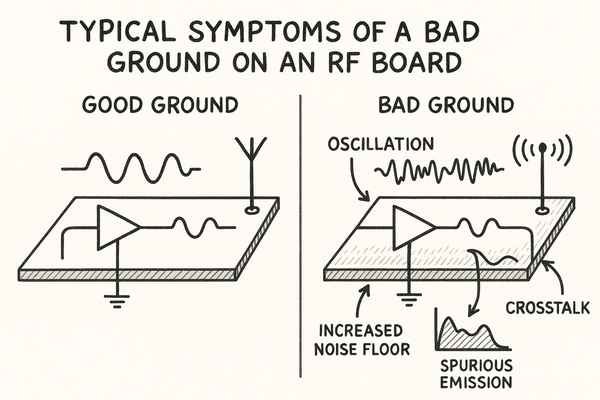
What are Typical Symptoms of a Bad Ground on an RF Board?
Is your RF circuit unstable, noisy, or underperforming despite what seems like a solid design? A compromised ground connection, or a poorly designed ground system, might be the hidden saboteur. What are the tell-tale signs?
Typical symptoms of a bad ground on an RF board include unwanted oscillations (especially in amplifiers), increased noise floor, spurious emissions, unstable or erratic performance, and signals coupling into unexpected places.
A low-impedance, stable ground reference is absolutely critical for the proper functioning of any RF circuit. When the ground system is inadequate, all sorts of strange problems can emerge because the ground is not the perfect, equipotential surface we often assume it to be.
Recognizing Grounding Problems
Here’s a table linking common symptoms to likely ground-related causes:
| Symptom | Likely Ground-Related Cause |
|---|---|
| Unwanted Oscillations | High ground inductance/resistance in amplifier emitter/source path creating feedback; poor decoupling path to ground. |
| Increased Noise Floor | Noise from digital or power sections coupling into RF ground; common impedance coupling. |
| Spurious Emissions (EMI) | Ground loops acting as antennas; inadequate shield grounding; noisy currents flowing through large ground areas. |
| Unstable/Erratic Performance | Intermittent ground connections (loose screw, cracked solder joint); varying ground impedance with temperature/flex. |
| Poor Isolation / Crosstalk | Shared ground impedance between circuit blocks allowing signal leakage. |
| Reduced Sensitivity (Receivers) | Increased noise floor due to ground noise pickup. |
| Distorted Output (Transmitters) | Ground bounce or instability modulating the signal. |
Ground inductance (\(L\)) becomes particularly problematic at RF, as its impedance (\(Z = j\omega L\), where \(\omega = 2\pi f\)) increases with frequency (\(f\)). Even a few nanohenries (\(\text{nH}\)) can create significant impedance. In one design, an LNA stage was oscillating. The via connecting the LNA’s source decoupling capacitor to the main ground plane was too far, creating excessive inductance. Adding a closer via solved it. Good grounding practices, like using multiple vias to connect component ground pads to the main ground plane, ensuring solid connections between different ground areas, and carefully planning return current paths, are vital. Books like "High-Speed Digital Design: A Handbook of Black Magic" by Howard Johnson and Martin Graham, though digitally focused, have excellent insights into ground impedance effects relevant to RF.
Conclusion
Effective RF PCB troubleshooting combines a systematic "Divide and Conquer" methodology with the correct application of essential test equipment and, importantly, keen observation and critical thinking. By understanding these potential failure modes and how to look for them, you can efficiently diagnose and resolve even the most complex RF issues.
-
Exploring the functionality of a Spectrum Analyzer can help you identify signal issues effectively. ↩
-
Understanding the VNA’s role can enhance your RF debugging skills and improve your project outcomes. ↩
-
Learning about Oscilloscope applications can significantly improve your signal analysis capabilities. ↩
-
Exploring the IPC-A-610 standard will provide you with essential guidelines for ensuring high-quality electronic assembly. ↩
-
This resource will provide insights into common problems with LNAs, including oscillation causes and solutions. ↩
-
Understanding the Rollett stability factor is crucial for ensuring amplifier stability; this link will guide you through the calculation process. ↩
-
Understanding impedance mismatch is crucial for optimizing RF circuit performance and minimizing signal loss. Explore this link for in-depth insights. ↩
-
Explore this resource to learn effective techniques for using freezer spray in electronics debugging, enhancing your troubleshooting skills. ↩
-
Understanding MIL-STD-810H can help you implement standardized testing methods for electronics, ensuring durability and reliability. ↩